
Building Insights: Full Lesson Plans
Earth’s Changing Atmosphere: Human Impacts and Climate Change
Topic Keyword(s):
Human Activity & Impacts
Weather & Climate
Guiding Question(s):
- In what ways is Global Warming affecting temperatures in different parts of the globe?
- Is Global Warming affecting different parts of the globe in the same way?
- What is the connection between air temperature and ocean temperature?
Placement in Curriculum: I use this to introduce a unit on climate change called “Earth’s Changing Atmosphere”. This helps ground the students in the human impacts of climate change even as we dive into the science. No prior background on climate science is required.
Learning Objectives:
Earth’s Changing Atmosphere: Life on Earth relies on a fragile atmosphere, which is being altered by human-induced greenhouse gasses, resulting in global climate changes.
- Students will explain the connection between greenhouse gas emissions from modern processes (industrial, transportation, agricultural, etc.) and our current climate crisis.
- Students will interpret global data sets which show specific examples of global climate change, will make connections between different data sets and offer hypotheses about why these connections may exist.
Human Impacts of Climate Change: Climate change impacts human societies by altering weather patterns, increasing natural disasters, and affecting resources, requiring adaptation and mitigation strategies for sustainable living.
- Students will describe examples of how the global climate crisis is affecting human societies now and in the future.
- Students will present specific examples of how humans may mitigate the future effects of climate change.
Standards Alignment:
Performance Expectations:
- MS-ESS3-5: Ask questions to clarify evidence of the factors that have caused the rise in global temperatures over the past century.
- MS-ESS3-4: Construct an argument supported by evidence for how increases in human population and per-capita consumption of natural resources impact Earth's systems.
Disciplinary Core Ideas:
- ESS2.A: Earth’s Materials and Systems
- ESS3.D: Global Climate Change
- ESS3.C: Human Impacts on Earth Systems
Science and Engineering Practices (SEP):
- Developing and Using Models
- Engaging in Argument from Evidence
Crosscutting Concepts (CCC):
- Patterns
- Scale, Proportion, and Quantity
- Cause and Effect
- Stability and Change
Link to Full Unit: Earth's Changing Atmosphere: Human Impacts and Climate Change
Estimated Length: 4-5 hours
Materials & Assets:

Featured Artwork: Helicopter Hands, Rolland Golden
Featured Data:
Sea Surface Temperature Anomaly (July 2023)
Nightime Lights
Hurricane Tracks
Survey Questions: Fenceposts Survey Questions
Fenceposts Template
Other Materials:
Slide with Norms for Observation and Discussion
Observation & Discussion Data Reflection
Data Visualization Choices Worksheet
Post-Fenceposts Reflection Worksheet
Post-Data Sketches Student Reflection Worksheet
Climate Data Art Project Extension Activity
Assessment (Optional):
Observation & Discussion Data Reflection
Data Visualization Choices Worksheet
Post-Fenceposts Reflection Worksheet
Post-Data Sketches Group CER Worksheet
Advice for Educators: Doing observation and discussion with students is an incredibly powerful way to get students to share in a collaborative way. I am always surprised at how students display flexible thinking during the process - there’s always a student or two who is adamant about what they think they are seeing, but then after listening to others they quickly change their thinking. Some groups where students feel more inhibited can show a reluctance to participate in the discussions at first. Giving students a chance to write first makes a big difference.
One of the important parts of this unit is the fenceposts activity, in which students get a chance to practice the process of thinking through what design tools might work best for a particular survey question. Although it can be somewhat time consuming to have students vote on which design tool to use, I think it was quite powerful to go through that exercise, because students really had to defend their choice of a particular tool. Then, after the activity, they can evaluate their choices. But giving students choice and voice in this process was important - not only did they buy into the activity, but it forced them to think more deeply about the design choices.
When doing the Data Sketches activity, don’t worry about students’ lack of background knowledge in terms of the connections they come up with. The purpose of this activity is not to get them to develop sophisticated claims, but rather to look at data and ask questions about what possible correlations might be possible. The questions they raise are more important than the answers they come up with.
Human Impacts on the Environment: Water Management in the Colorado River Basin
Topic Keyword(s):
Human Activity & Impacts
Biology
Earth & Environmental Science
Weather & Climate
Guiding Question(s):
- What are the effects of human activity on freshwater resources?
Learning Objectives:
Human Impact on the Environment: Students will identify examples of short and long term environmental changes and assess the impact of environmental changes on populations and species.
Biodiversity: Students will identify how biodiversity contributes to the sustainability of an ecosystem, identify the factors that affect and can threaten biodiversity, and examine ways to protect biodiversity.
Human Impact on Resources: Students will identify negative and positive impacts that human activity (i.e., dams/reservoirs, crop land, pasture land, and population density) has had on Earth’s resources in the Colorado River Basin.
Standards Alignment:
Performance Expectations:
- MS-ESS3-4: Construct an argument supported by evidence for how increases in human population and per-capita consumption of natural resources impact Earth's systems.
Science & Engineering Practices:
- Analyzing and Interpreting Data
- Engaging in Argument from Evidence: Construct an oral and written argument supported by empirical evidence and scientific reasoning to support or refute an explanation or a model for a phenomenon or a solution to a problem.
Disciplinary Core Ideas:
- ESS3.C: Human Impacts on Earth Systems: Typically as human populations and per-capita consumption of natural resources increase, so do the negative impacts on Earth unless the activities and technologies involved are engineered otherwise.
Crosscutting Concepts:
- Cause and Effect: Cause and effect relationships may be used to predict phenomena in natural or designed systems.
- Influence of Science, Engineering, and Technology on Society and the Natural World: All human activity draws on natural resources and has both short and long-term consequences, positive as well as negative, for the health of people and the natural environment.
- Science Addresses Questions About the Natural and Material World: Scientific knowledge can describe the consequences of actions but does not necessarily prescribe the decisions that society takes.
Colorado Academic Standards:
- Earth Science: Students know and Understand the processes and interactions of Earth’s systems and the structure and dynamics of Earth and other objects in space.
- Prepared Graduates in Science: Students can use the full range of science and engineering practices to make sense of natural phenomena and solve problems that require understanding how human activities and the Earth’s surface processes interact.
- Grade Level Expectation: Human activities have altered the biosphere, sometimes damaging it, although changes to environments can have different impacts for different living things.
- Academic Context and Connections: Construct an oral and written argument supported by empirical evidence and scientific reasoning to support or refute an explanation or a model for a phenomenon or a solution to a problem.
Link to Full Unit: Human Impacts on the Environment: Water Management in the Colorado River Basin
Estimated Length: 4.5 hours (implemented over 3 weeks)
Materials & Assets:
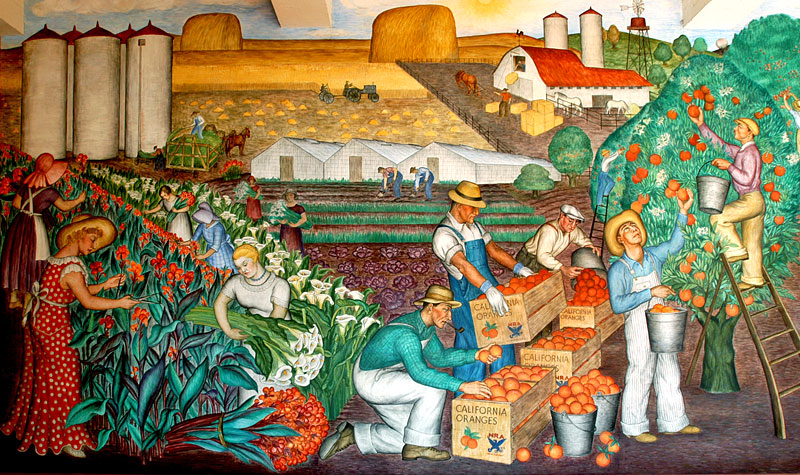
Featured Artwork: California - Coit Tower Mural
Featured Data:
Population Density
Dams and Reservoirs
Crop Land
Pasture Land
Other Materials:
Fenceposts Survey Questions
Assessment: Each lesson has both formative and summative assessment pieces. For the BIO lesson portion of the unit, I only provided formative feedback. The goal was to encourage students to participate in a low risk environment and work in a collaborative and cooperative environment as they develop data analysis skills used to meet our learning objectives.
Advice for Educators: It was really surprising how the Observation & Discussion facilitation techniques helped classroom cultures. Specifically, improving collaboration and cooperation. The norms established in this activity became the norms for many of our classroom activities. It helps slow students down, listen to what others have to say, and reflect on the problem at hand. The parking lot questions generated were surprisingly insightful and provided a link to the remainder of the unit. I found it impactful to connect the global data sets for the BIO lesson to the final unit project, a summative assessment on the effects of human activity on freshwater resources in the Colorado River Basin.
One must be willing to allocate the time needed to add this to your unit. The emphasis on using the BIO lesson was to help students when analyzing data, and I found that these skill sets helped do that:
- Create a classroom culture built on collaboration and cooperation
- Slow down the process
- Value listening to other people's observations
- Reflect on what you see and hear
- Clearly identify what you know and what you do not about the data set
This was more important than focusing on how to graph, mathematically, quantify data, etc.. What is the data telling us and what is missing?
Plant Processes: From Seed to Feed
Topic Keyword(s):
Human Activity & Impacts
Biology
Organisms & Environments
Plant Processes
Photosynthesis
Guiding Question(s):
- Which level of organization is most vital for equilibrium?
- What would happen if a population of organisms were removed from or added to an ecosystem?
- How do changes in abiotic factors affect the biotic factors of an environment?
- In what ways do the relationships among biotic factors impact an organism’s survival?
- In what ways can an organism impact an ecosystem?
- Which is more successful, natural selection or artificial selection?
- What would be the effects of stopping artificial selection of crops and livestock?
Placement in Curriculum: Organisms and environments. All living organisms are made up of smaller units called cells. Ecosystems are organized into communities, populations, and organisms. Students compare and contrast variations within organisms and how they impact survival. Students examine relationships and interactions between organisms, biotic factors, and abiotic factors in an ecosystem.
Learning Objectives: Students will be able to explain and predict how disruptions impact the transfer of energy in food webs within ecosystems.
Standards Alignment:
List the most relevant NGSS performance expectations, science and engineering practices, disciplinary core ideas, and/or crosscutting concepts.
Performance Expectations:
- MS-LS2-1: Analyze and interpret data to provide evidence for the effects of resource availability on organisms and populations of organisms in an ecosystem.
- MS-LS1-6: Construct a scientific explanation based on evidence for the role of photosynthesis in the cycling of matter and flow of energy into and out of organisms.
Link to Full Unit: Plant Processes: From Seed to Feed
Estimated Length: 4 hours
Materials & Assets:
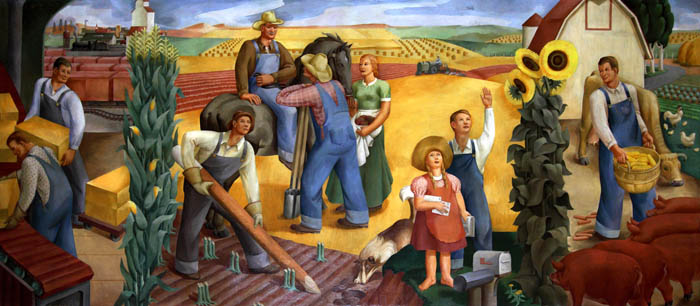
Featured Artwork: Kansas Farming (1936), Richard Haines
Featured Data:
Greenness (Normalized Difference Vegetation Index)
Agriculture: Food vs. Feed
Land Surface Temperature (Night)
Population Density
Other Materials:
Fenceposts Survey Questions
Assessment (Optional):
Advice for Educators: The Fencepost activity was extraordinarily insightful as an informal assessment of background knowledge of students at the beginning of the unit. The instant visualization that only two students out of all classes had ever grown anything from seed to flower or fruit led to the incorporation of an additional activity. Students were given the opportunity to sprout seeds, grow them hydroponically, and then take them home or plant them in a campus garden.
Background Materials:
Brief description and simple guide for the Kratky Gardening Method
Tides: Understanding Impacts on Human Activity Around the Globe
Topic Keyword(s):
Earth & the Solar System
Weather & Climate
Guiding Question(s):
- How might tides impact human activity in different parts of the globe?
- Are there connections between tidal patterns and sea surface temperatures?
- What impact, if any, might high and low tides have on sea surface temperatures?
Placement in Curriculum: I started with an overall introduction to Earth and the Solar System, starting with the Big Bang and the theories that support it. Which led into the theories behind the creation of our moon, and giving them some background information on the moon and how it is both impacted by, and impacts gravity on Earth. With this basis for the phenomenon of how the moon impacts our tides I started with BIO.
Learning Objectives:
- Students will explore how high and low tides vary in different parts of the world.
- Students will compare and contrast visual datasets depicting tidal variations, sea surface temperatures, and shipping routes.
- Students will look for patterns and determine if there is a correlation between the datasets, and what that correlation may imply.
Standards Alignment:
Disciplinary Core Ideas:
- ESS1.A: Patterns of the apparent motion of the sun, the moon, and stars in the sky can be observed, described, predicted, and explained with models.
- ESS2.C: Global movements of water and its changes in form are propelled by sunlight and gravity.
- ESS2.D: The ocean exerts a major influence on weather and climate by absorbing energy from the sun, releasing it over time, and globally redistributing it through ocean currents.
Crosscutting Concepts:
- Patterns
- Graphs, charts, and images can be used to identify patterns in data.
- Patterns in rates of change and other numerical relationships can provide information about natural systems.
- Patterns can be used to identify cause-and-effect relationships.
- Models
Models can be used to represent systems and their interactions—such as inputs, processes and outputs—and energy and matter flows within systems.
Models are limited in that they only represent certain aspects of the system under study.
Science and Engineering Practices
- Developing and Using Models
- Evaluate limitations of a model for a proposed object or tool.
- Develop and/or use a model to predict and/or describe phenomena.
- Analyzing and Interpreting Data
- Use graphical displays (e.g., maps, charts, graphs, and/or tables) of large data sets to identify temporal and spatial relationships.
- Distinguish between causal and correlational relationships in data.
- Analyze and interpret data to provide evidence for phenomena.
- Consider limitations of data analysis (e.g., measurement error), and/or seek to improve precision and accuracy of data with better technological tools and methods (e.g., multiple trials).
- Analyze and interpret data to determine similarities and differences in findings.
Full Unit: Tides: Understanding Impacts on Human Activity Around the Globe
Estimated Length: 5-6 hours
Materials & Assets:

Featured Artwork: Low tide and boats in English harbour
Featured Data:
Shipping Routes
Sea Surface Temperature
Tidal Elevation
Other Materials:
Observation & Discussion Slide Deck: Powerpoint, pdf
Fencepost Survey Questions
Fencepost Slide Deck: Powerpoint, pdf
Data Sketches Slide Deck: Powerpoint, pdf
Assessment (Optional): I assigned the Data Visualization Choices worksheet as homework. In hindsight, if I had more time, I would have reviewed the worksheet with my students as a class. I did not use any formal assessment tools. However, if I were to do it again, I might have the students do a personal assessment of their own participation.
Advice for Educators: Don’t be intimidated by the Observation & Discussion facilitation approach or their familiarity with visual datasets. Application of this unit takes practice, but getting it “wrong” can be informative, and your students will most likely enjoy it all the same. For teachers of younger students (6th grade) to give some more scaffolding, maybe even present an example of both fenceposts and data sketches before launching the activities. If I were to do it again, I might use the parking lot later, when the relevant data sketches are being introduced. I think that would lead to more relevant questions to further the lesson and the greater unit they are a part of.
Mapping Human Impacts: Human Activity and the Environment
Topic Keyword(s):
Human Activity & Impacts
Guiding Question(s):
- What data do we have on how humans are impacting the environment?
Learning Objectives: Students will compare data to identify patterns between human population centers and environmental degradation.
Standards Alignment:
Performance Expectations:
- MS-ESS3-3. Apply scientific principles to design a method for monitoring and minimizing a human impact on the environment.
- MS-ESS3-4. Construct an argument supported by evidence for how increases in human population and per-capita consumption of natural resources impact Earth's systems.
Disciplinary Core Ideas:
- Human Impacts on Earth Systems
Human activities have significantly altered the biosphere, sometimes damaging or destroying natural habitats and causing the extinction of other species. But changes to Earth’s environments can have different impacts (negative and positive) for different living things.
Typically as human populations and per-capita consumption of natural resources increase, so do the negative impacts on Earth unless the activities and technologies involved are engineered otherwise.
Science & Engineering Practices:
- Constructing Explanations and Designing Solutions: Apply scientific principles to design an object, tool, process or system.
- Engaging in Argument from Evidence: Construct an oral and written argument supported by empirical evidence and scientific reasoning to support or refute an explanation or a model for a phenomenon or a solution to a problem.
Crosscutting Concepts:
- Patterns: Graphs, charts, and images can be used to identify patterns in data.
Full Unit: Mapping Human Impacts: Human Activity and the Environment
Estimated Length: 4 hours
Materials & Assets:
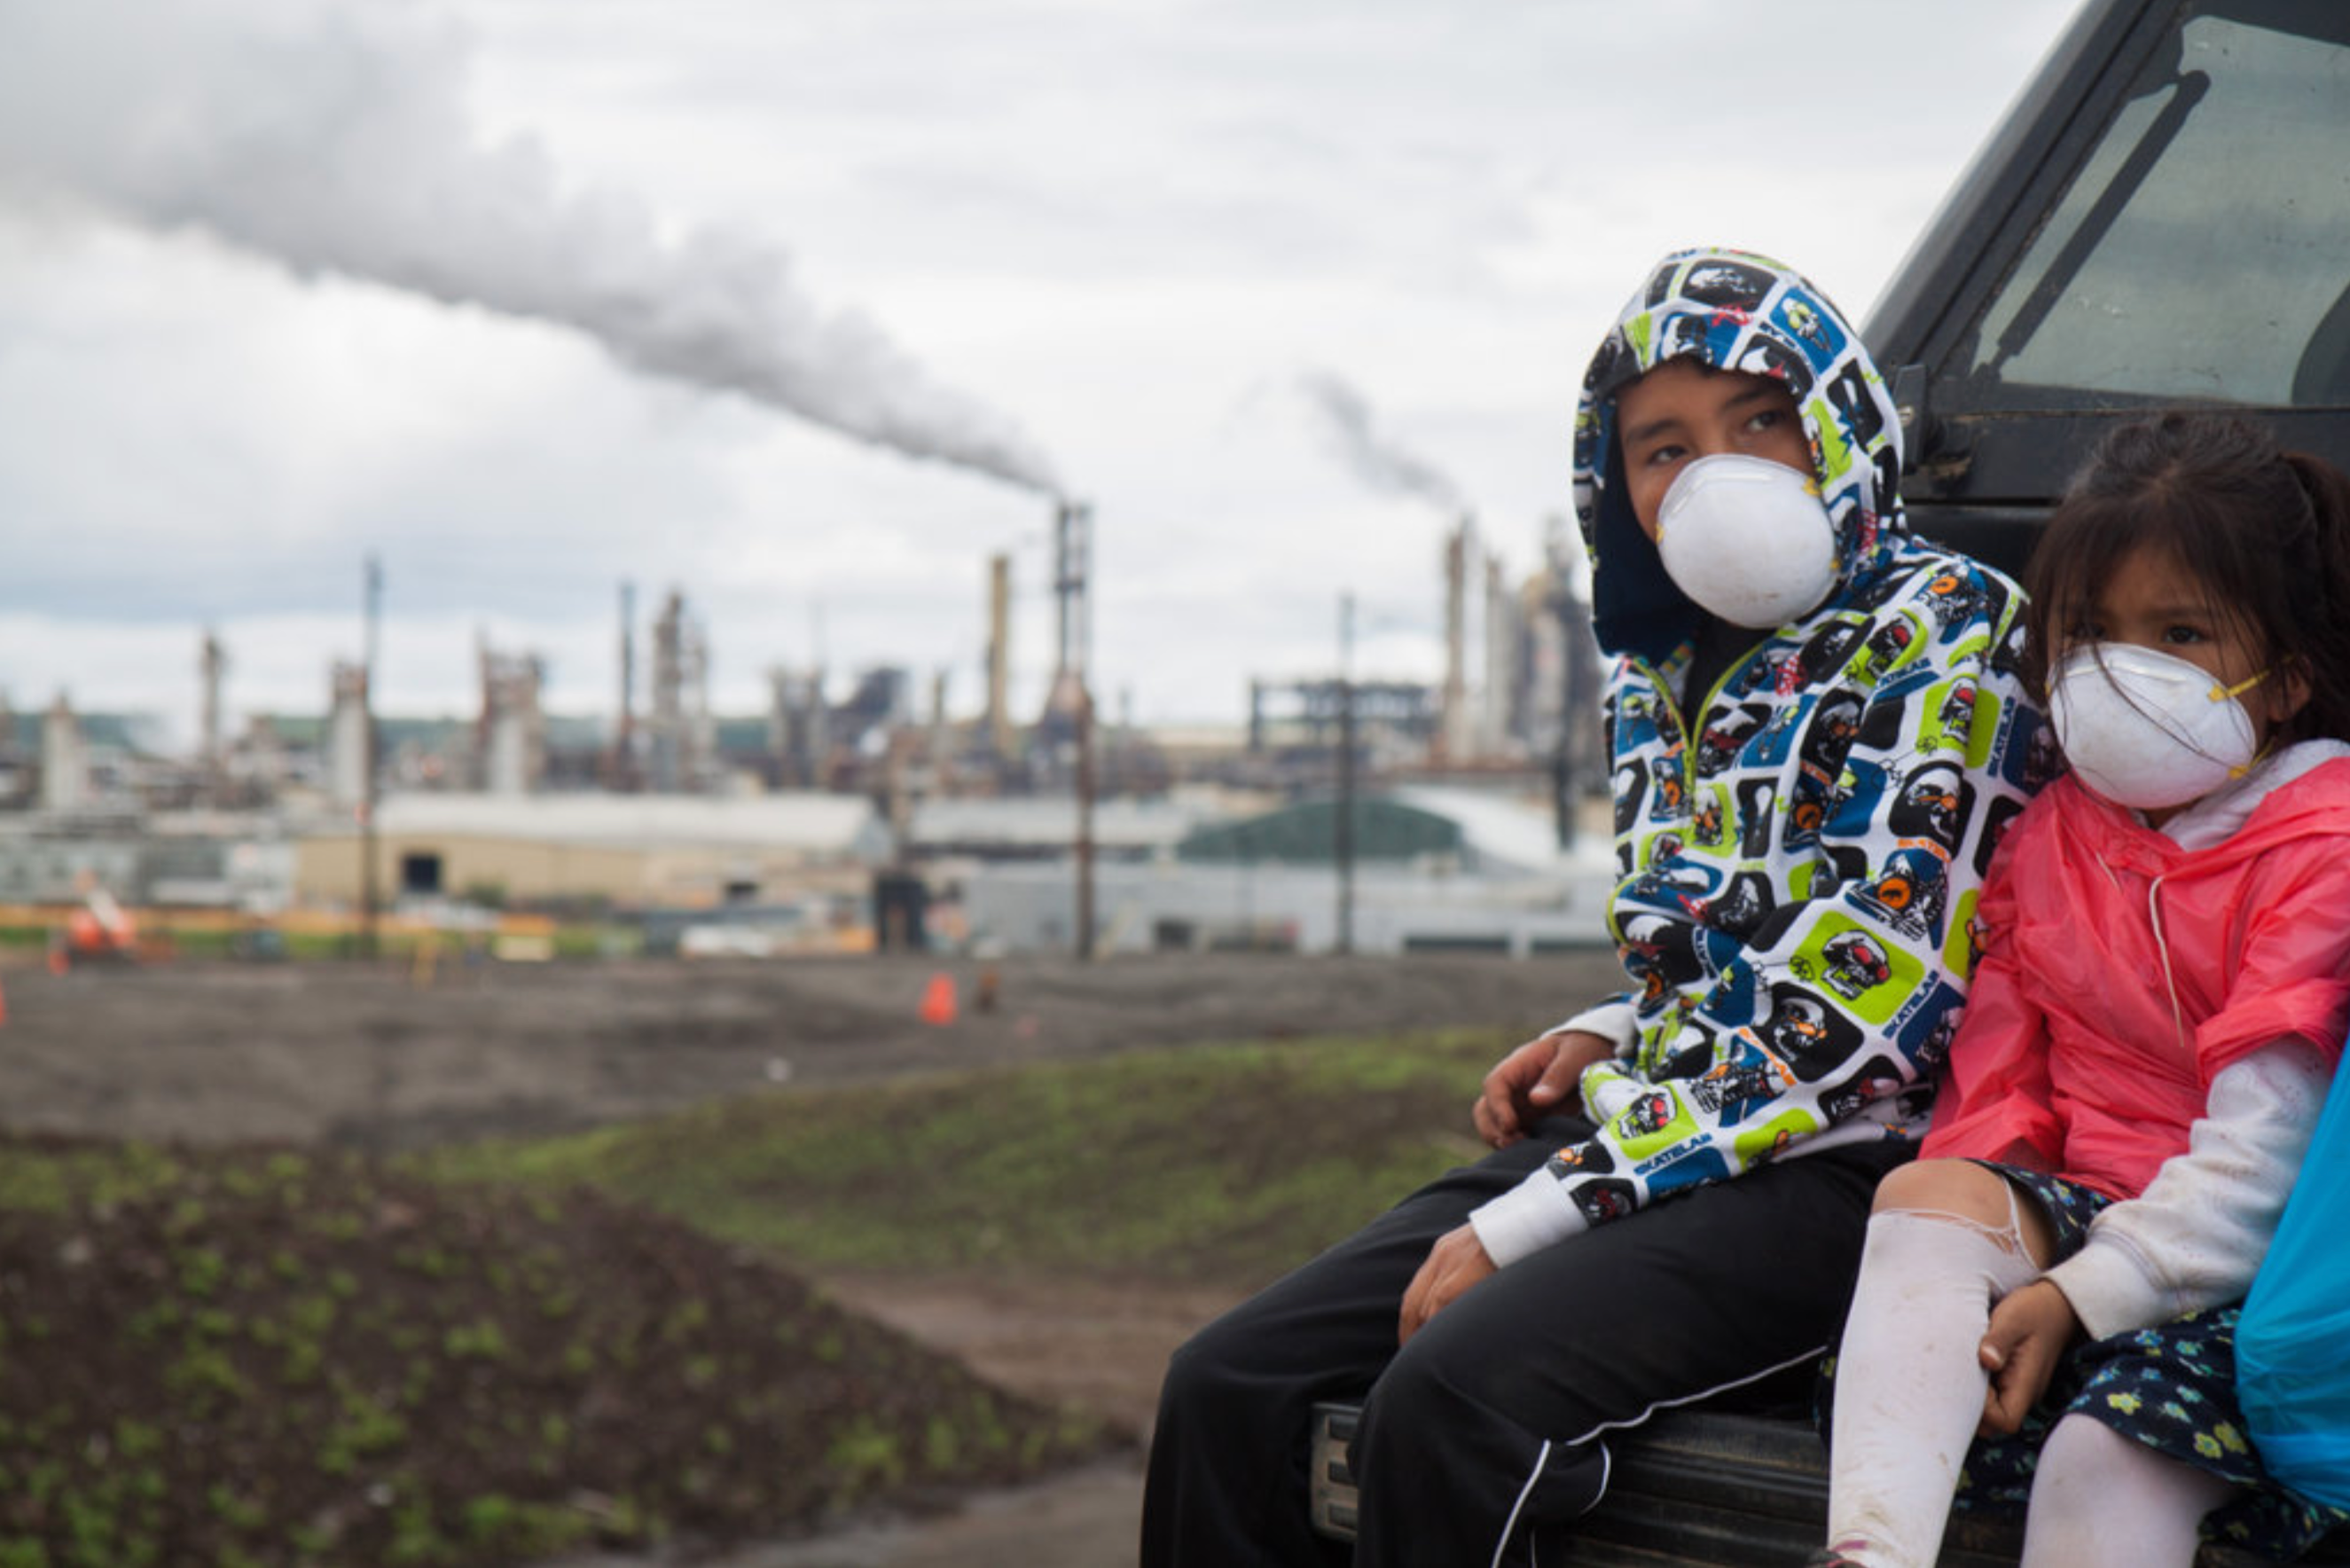
Featured Artwork: The Healing Walk, Ben Powless
Featured Data:
Temperature Anomaly
Coral Bleaching Alerts
Human Impact on Marine Ecosystems
Cropland Production Gap
Fisheries Species Richness
Forest Gain and Loss
Loggerhead Sea Turtle Tracks
Human Climate Niche
Light Pollution
Human Transportation
Population by Country
Survey Questions: Fencepost Questions for Mapping Human Impacts
Additional Materials:
Observation & Discussion Slide Deck
Fencepost Slide Deck
Data Sketches Slide Deck
Synthesis Discussion Slide Deck
Advice for Educators: For the final map project, we suggest that you require a minimum number of students to do Environmental Impacts maps and Human Activity maps to create a final layered product that will lead to rich questions about the relationships.
Drought: Examining the Causes and Effects of Precipitation Shortage
Topic Keyword(s):
Human Activity & Impacts
Weather & Climate
Guiding Question(s): What factors contribute to the development of droughts?
Learning Objectives:
- Students will be able to identify the causes and explain some effects of droughts.
Standards Alignment:
Performance Expectations:
- MS-ESS2-4: Develop a model to describe the cycling of water through Earth's systems driven by energy from the sun and the force of gravity.
- HS-ESS2-2: Analyze geoscience data to make the claim that one change to Earth's surface can create feedback that cause changes to other Earth systems.
- HS-ESS3-1: Construct an explanation based on evidence for how the availability of natural resources, occurrence of natural hazards, and changes in climate have influenced human activity.
Science and Engineering Practices:
- Developing and Using Models: Creating representations to explain water cycle and weather patterns.
- Analyzing and Interpreting Data: Examining climate data to understand trends and causes of drought.
- Engaging in Argument from Evidence: Using data to support claims about human impact on drought frequency and severity.
Disciplinary Core Ideas:
- ESS2.C: The Roles of Water in Earth's Surface Processes: The movement of water through the hydrologic cycle and its impact on weather and climate.
- ESS3.B: Natural Hazards: Understanding natural hazards, including droughts, and their impact on human society.
Crosscutting Concepts:
- Cause and Effect: Understanding the causative factors behind drought development.
- Systems and System Models: Examining Earth’s systems and the interactions that lead to droughts.
Link to Full Unit: Drought: Examining the Causes and Effects of Precipitation Shortage
Estimated Length: 5.5 hours (implemented over 9 class periods)
Materials & Assets:
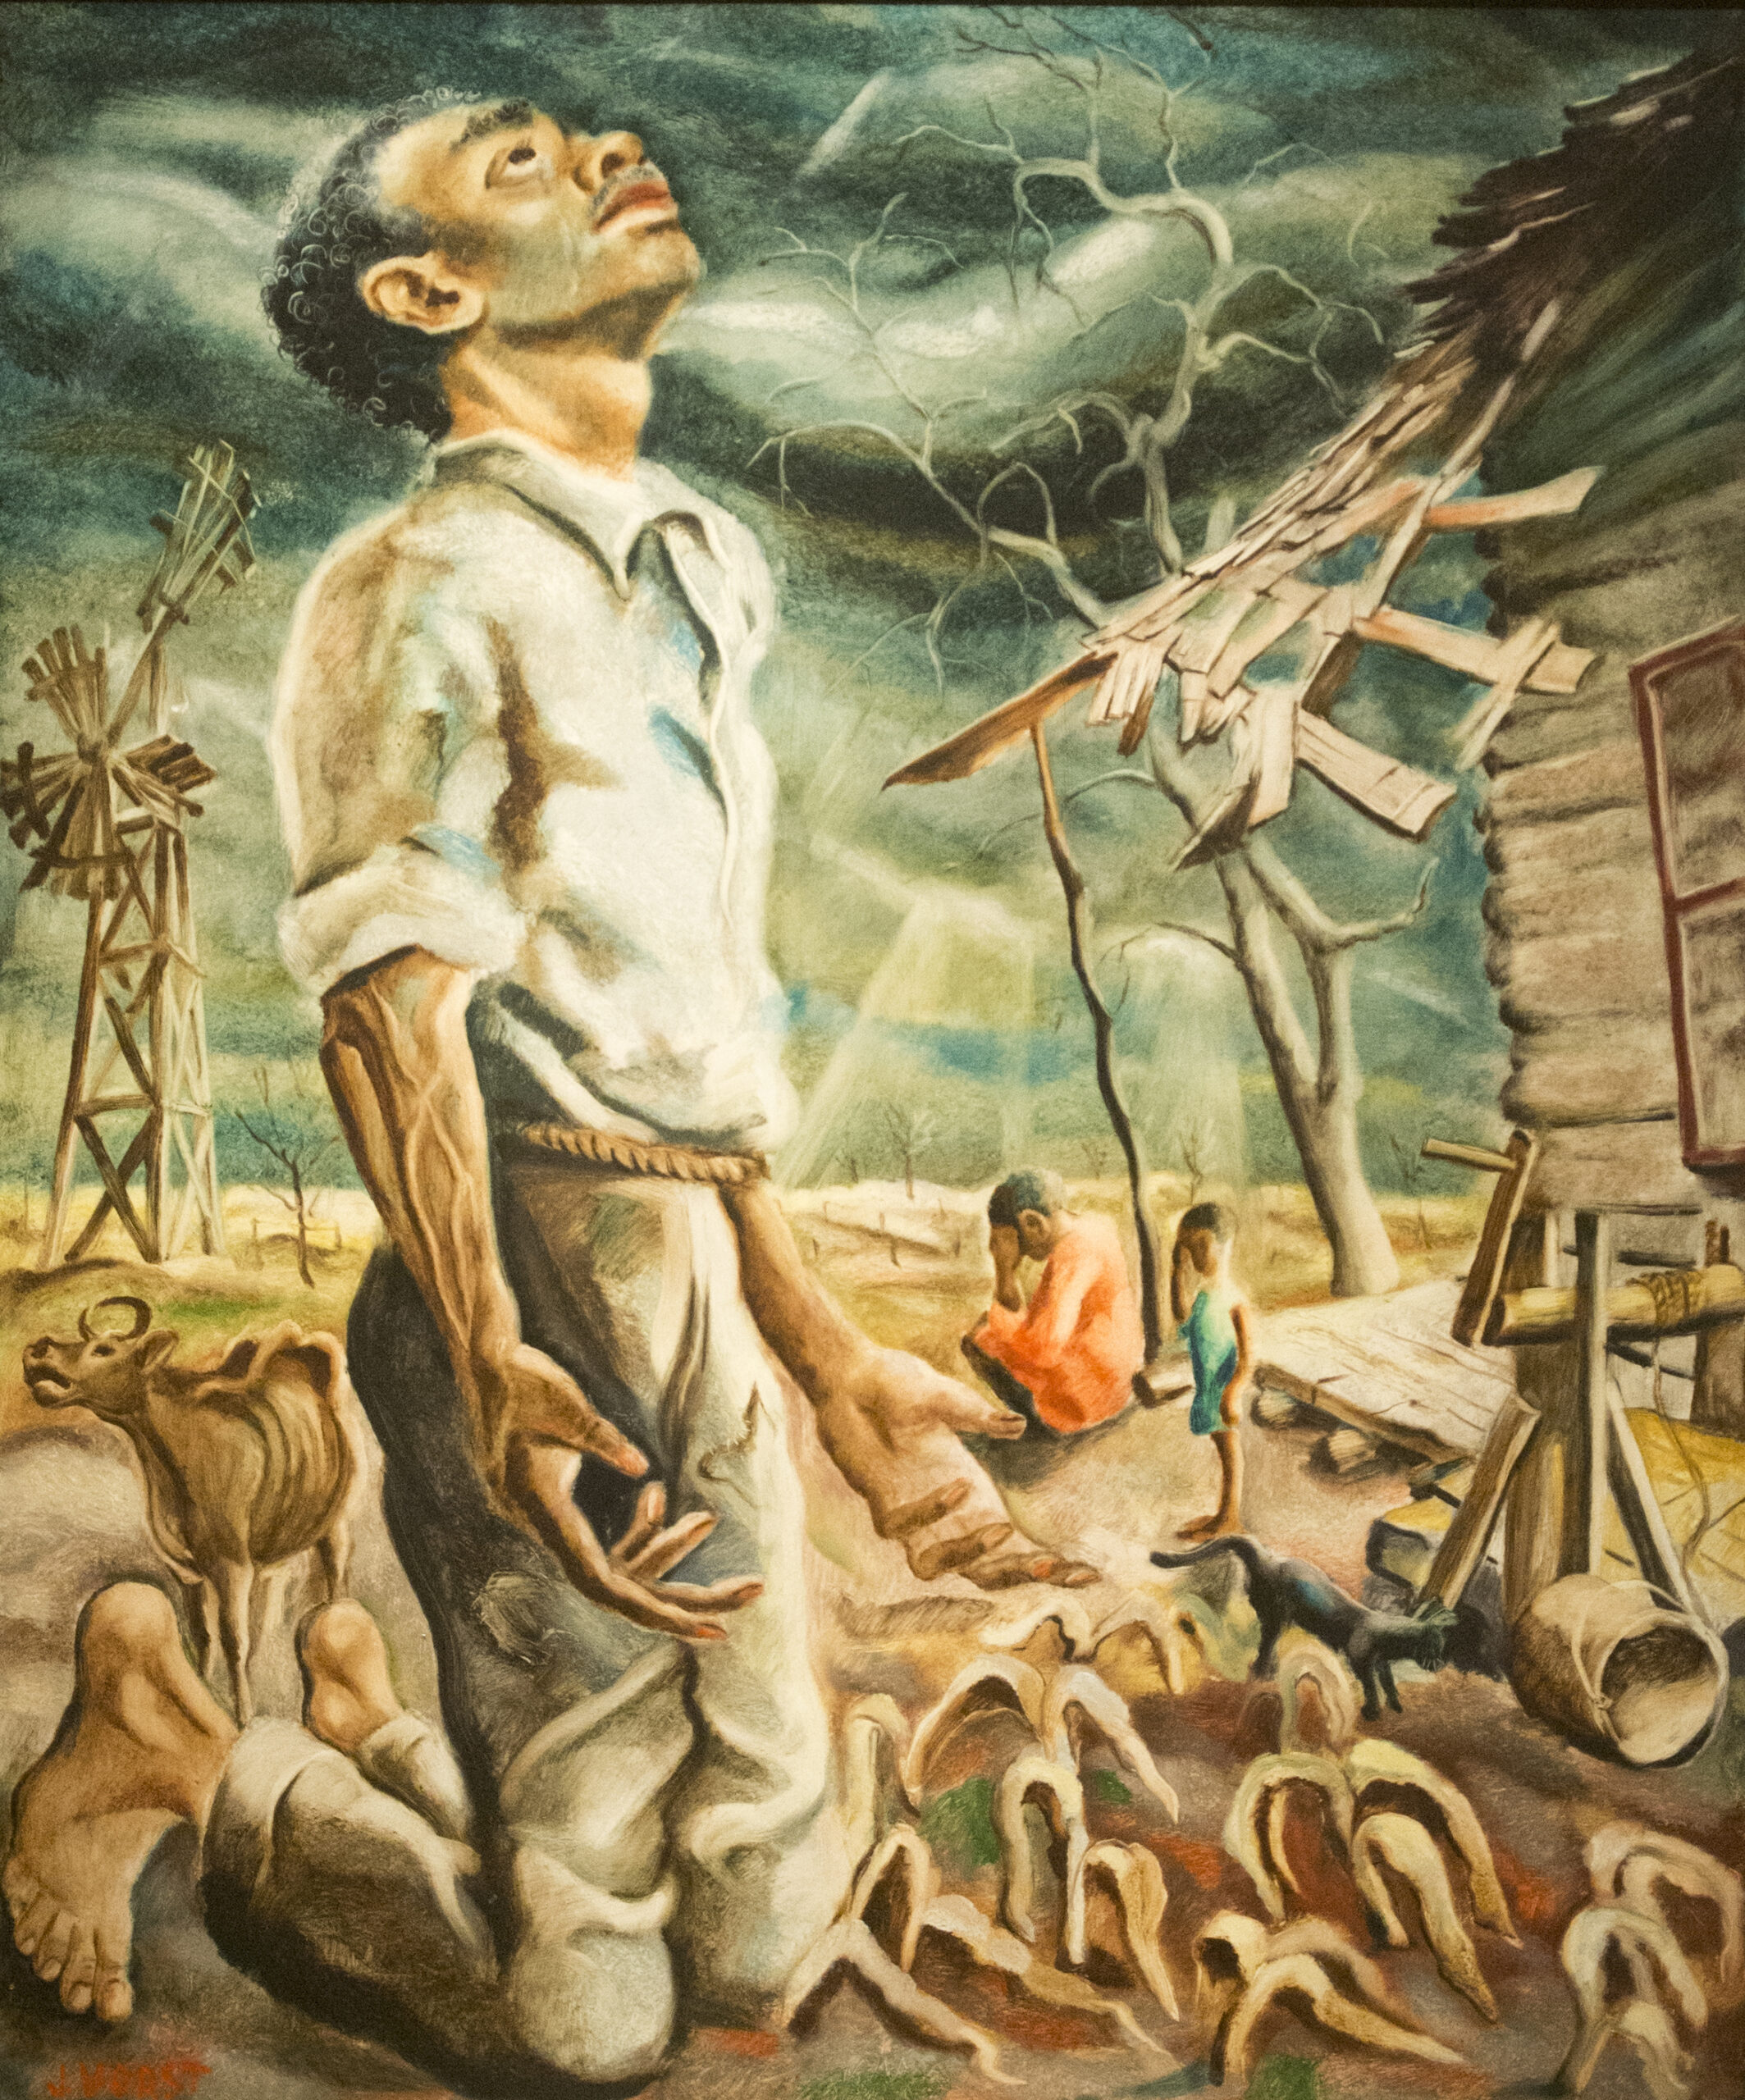
Featured Artwork:
Jacob Kainen, Federal Art Project (New York City), Drought, 1935
Alexandre Hogue, Drouth Survivors, 1936, Oil on canvas, Musée de la cooperation franco-américan, Blérancourt, France.
Joseph Paul Vorst, American (1897-1947), Drought, oil on masonite, 30 x 25 inches
Featured Data
Drought Intensity
Freshwater Withdrawals
Statewide Maximum Temperature Ranks
Statewide Precipitation Ranks
Survey Questions: Drought Fenceposts Questions
Other Materials:
Observation & Discussion Slide Deck: Powerpoint, pdf
Water Cycle Dice Game
Water Cycle Board Game
Water on Earth Spreadsheet
What is drought? (UNL National Drought Mitigation Center)
How does drought affect our lives? (UNL National Drought Mitigation Center)
Why is America running out of water? (National Geographic)
Can we protect ourselves from drought? (UNL National Drought Mitigation Center)
Assessment (Optional): Have the students write a claim, evidence, and reasoning in response to the guiding question: Why should communities prepare for drought?
Advice for Educators:
The most surprising and successful moments came from the hands-on activities. Students were particularly engaged during the Observation & Discussion exercise, where they closely examined drought images and shared their observations. This activity not only enhanced their observational skills but also fostered a collaborative learning environment. The Fence Post Activity was another highlight, as it allowed students to visually and collectively analyze data, making patterns and trends more comprehensible.
Students needed more support in connecting practical activities to theoretical concepts. They often found it challenging to link their observations and data analysis to the broader causes and effects of droughts. To address this, I incorporated more guided discussions and scaffolded reflection activities, which helped bridge this gap.
For educators planning to use this unit, I recommend emphasizing the connection between activities and theoretical knowledge. Regularly check for understanding and be flexible in providing differentiated support. Encourage students to share their ideas and observations openly, fostering a collaborative and inclusive classroom atmosphere. Finally, ensure that reflective writing and discussions are integral parts of the unit, as these help solidify students' understanding and link practical experiences to theoretical concepts.
Background Information (Optional):
Droughts are complex phenomena influenced by a variety of interrelated factors. Here are the primary contributors:
- Climate and Weather Patterns:
- Temperature: Higher temperatures increase evaporation rates and reduce water availability.
- Precipitation Deficit: Prolonged periods of below-average precipitation are the direct cause of meteorological droughts.
- Wind Patterns: Changes in wind patterns can shift weather systems, leading to reduced rainfall in certain areas.
- Geographical Factors:
- Topography: Mountain ranges can block moist air masses, creating rain shadows and arid regions.
- Proximity to Water Bodies: Areas far from large water bodies tend to receive less rainfall.
- Soil Characteristics:
- Soil Moisture Retention: Soils with low moisture retention capacities (e.g., sandy soils) can exacerbate drought conditions.
- Soil Type and Vegetation: Different soil types and vegetation cover influence the rate of evaporation and water retention.
- Human Activities:
- Agricultural Practices: Over-irrigation, deforestation, and poor land management can deplete water resources.
- Urbanization: Increased surface runoff and reduced natural recharge areas can lower groundwater levels.
- Water Usage: Excessive withdrawal of water for industrial, agricultural, and domestic use can contribute to drought.
- Climate Change:
- Global Warming: Rising global temperatures alter precipitation patterns and increase the frequency and severity of droughts.
Shifts in Climate Zones: Changing climate zones can make some areas more prone to droughts.
Ecosystem Dynamics: Bat Populations in a Changing Environment
Topic Keyword(s):
Biology
Guiding Question(s):
- Why are bats essential to the environment?
Learning Objectives:
- Students will be able to explain why bats are important to the environment.
- Students will be able to identify causes for declines in the bat populations.
Standards Alignment:
Performance Expectations:
- MS-LS2-1: Analyze and interpret data to provide evidence for the effects of resource availability on organisms and populations of organisms in an ecosystem.
- MS-LS2-2: Construct an explanation that predicts patterns of interactions among organisms across multiple ecosystems.
- HS-LS2-6: Evaluate claims, evidence, and reasoning that the complex interactions in ecosystems maintain relatively consistent numbers and types of organisms in stable conditions, but changing conditions may result in a new ecosystem.
- HS-LS4-5: Evaluate the evidence supporting claims that changes in environmental conditions may result in (1) increases in the number of individuals of some species, (2) the emergence of new species over time, and (3) the extinction of other species.
Science & Engineering Practices:
- Analyzing and Interpreting Data: Using data to understand the role bats play in ecosystems, such as their impact on insect populations and plant pollination.
- Engaging in Argument from Evidence: Evaluating and arguing the importance of bat conservation based on scientific evidence.
- Obtaining, Evaluating, and Communicating Information: Gathering and disseminating information about bats and their ecological importance to various stakeholders.
Disciplinary Core Ideas
- LS2.A: Interdependent Relationships in Ecosystems: Bats as pollinators, seed dispersers, and pest controllers show how organisms and their environments interact.
- LS2.C: Ecosystem Dynamics, Functioning, and Resilience: Understanding how bats contribute to ecosystem stability and how their decline can impact ecosystem health.
- LS4.D: Biodiversity and Humans: The impact of bats on biodiversity and the benefits to humans through ecosystem services.
Crosscutting Concepts
- Cause and Effect: Understanding the cause-effect relationships between bat activities (pollination, pest control) and ecosystem health.
- Systems and System Models: Viewing ecosystems as interconnected systems where bats play a crucial role.
- Stability and Change: Analyzing how changes in bat populations can affect ecosystem stability and lead to broader environmental changes.
Link to Full Unit: Ecosystem Dynamics: Bat Populations in a Changing Environment
Estimated Length: 5 hours (implemented over 7 class periods)
Materials & Assets:
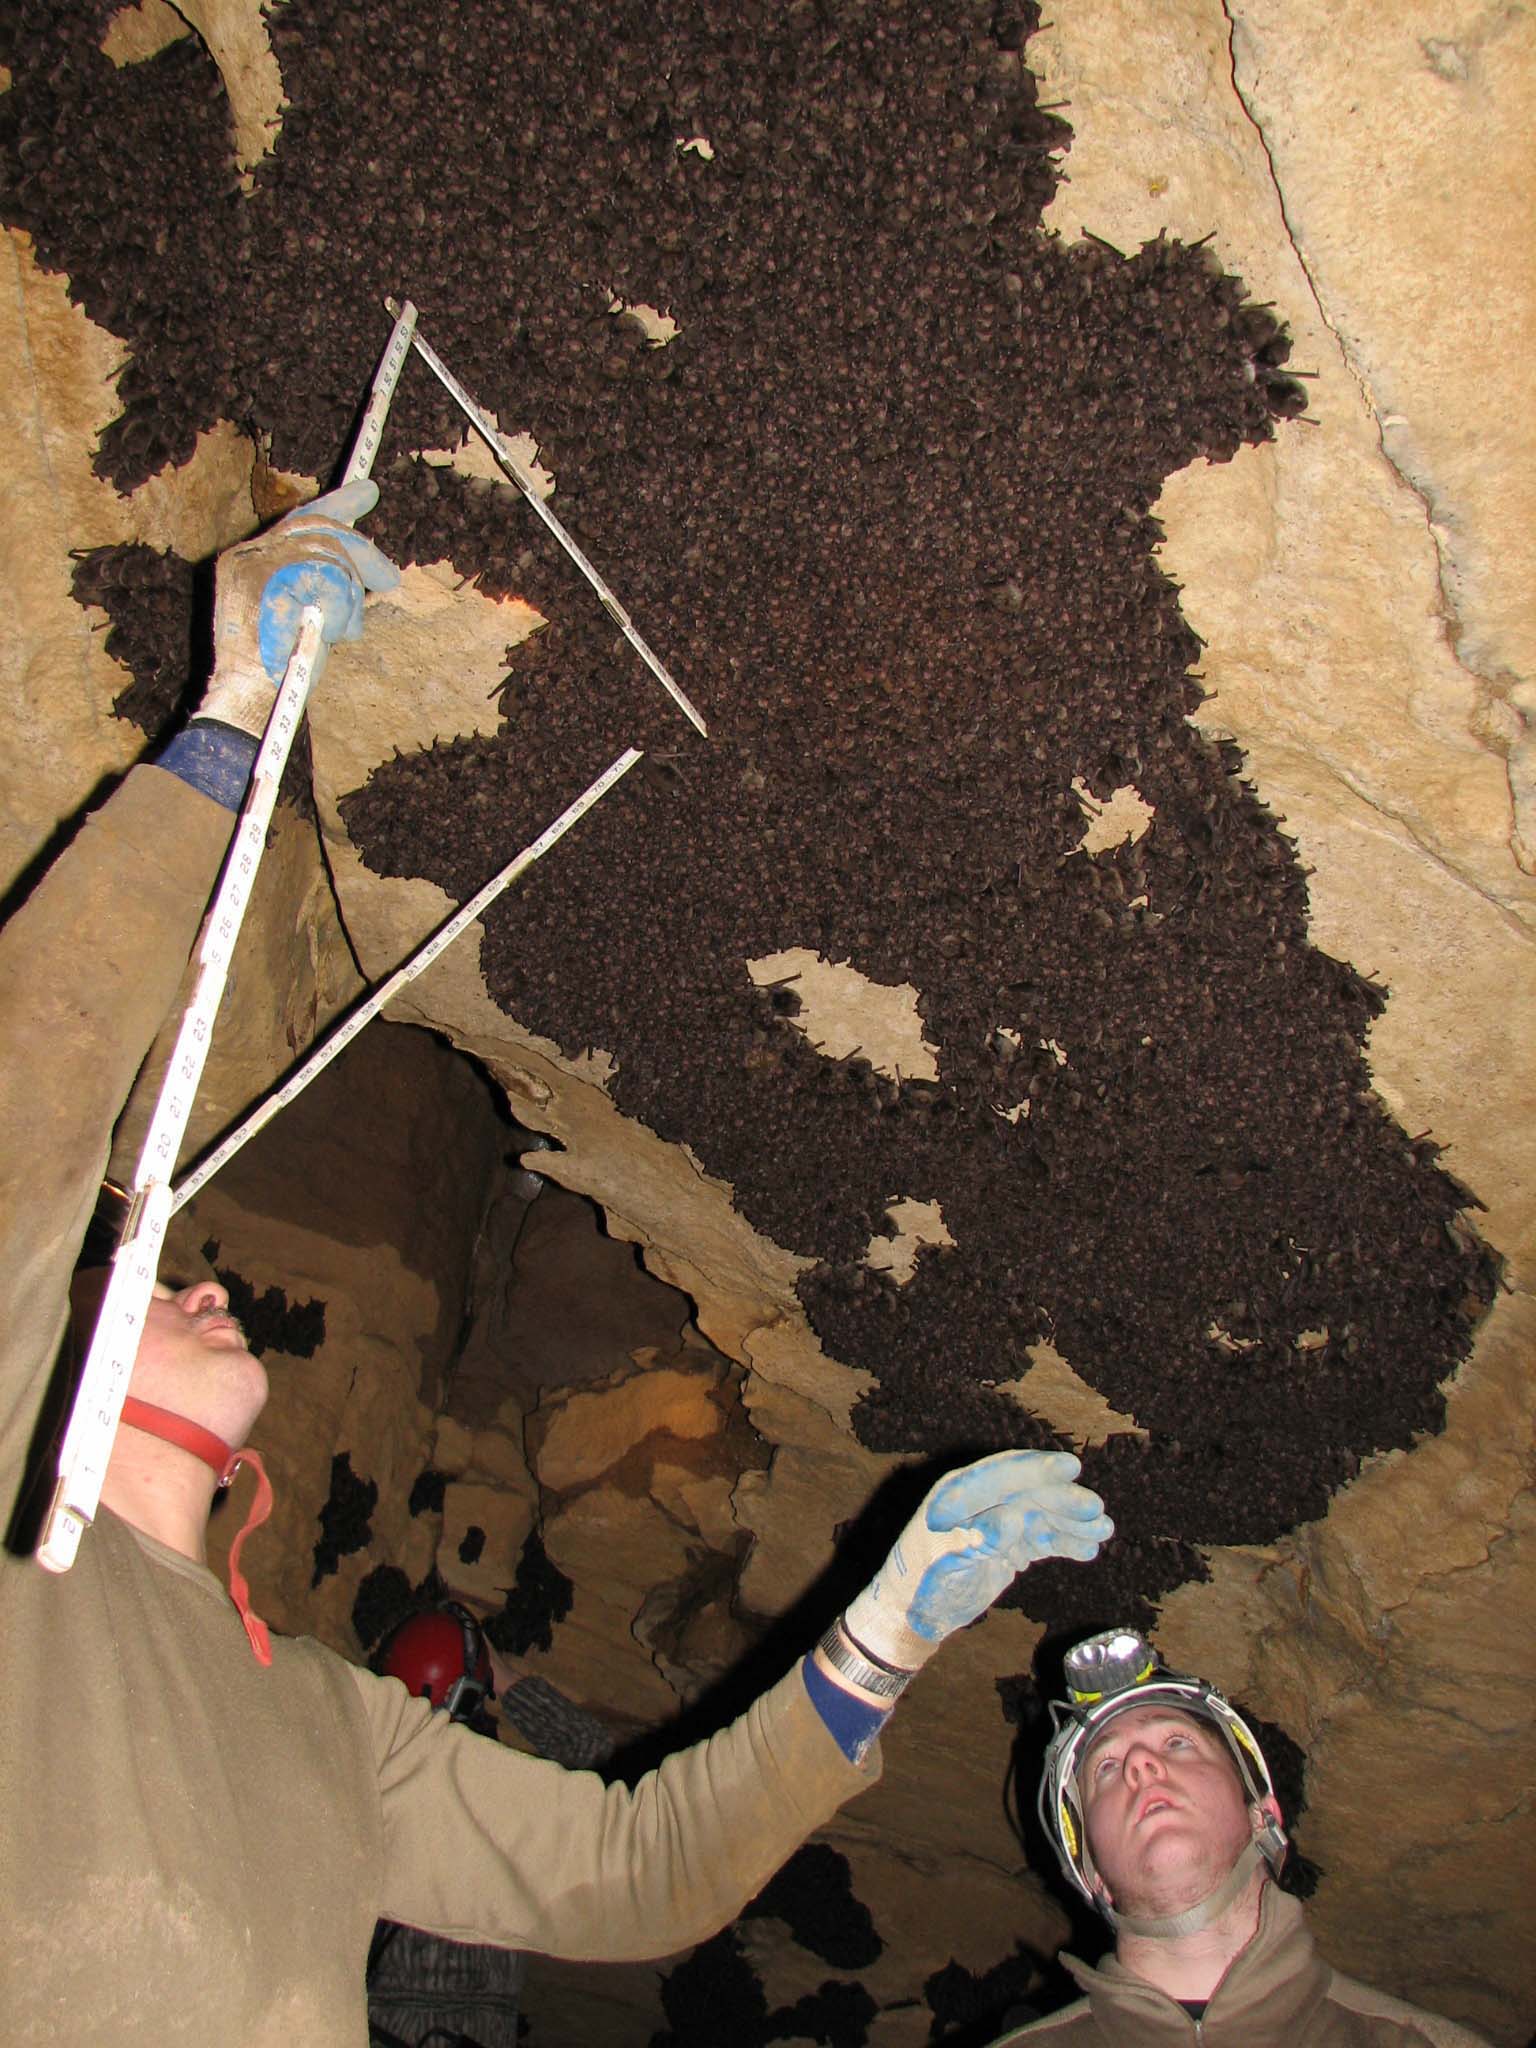
Indiana bat (Myotis sodalis) survey in Ray's Cave, 2007.
Featured Artwork:
Filming swabbing bats, collecting air samples
Biologists conduct modern bat surveys, Photo by Andrew King, USFWS
Featured Data:
Bat Diversity in US National Parks
Projected Spread of White Nose Syndrome
Population Density
Survey Questions: Fencepost Questions
Other Materials:
Observation & Discussion Slide Deck: Powerpoint, pdf
Bat Week Website
Bat Week Announcements
Assessment (Optional): Have the students write a claim, evidence, and reasoning in response to the guiding question: Why are bats essential to the environment?
Advice for Educators: Teaching this unit why bats are essential to the environment has been highly rewarding, with several noteworthy successes and challenges, and the most successful moments included the initial Observation & Discussion activity, where students demonstrated keen observational skills and engaged in thoughtful discussions about bat images. This exercise helped them build a solid foundation for understanding the importance of bats. Students were particularly captivated by the interactive and visual aspects of the unit, such as the fencepost activity and creating bat posters, which fostered creativity and collaboration.
I found that students needed more support during the research phase, specifically in navigating and synthesizing information from the provided websites. Some students struggled with identifying reliable sources and summarizing their findings effectively. Providing additional guidance on research skills and perhaps a structured template for the posters could alleviate these difficulties.
If I were to teach this unit again, I would integrate more structured scaffolding for the research activities and allocate more time to the map design and data interpretation sections. Incorporating a peer review process for the posters could also enhance the learning experience, allowing students to receive constructive feedback before the final presentation.
For educators interested in using this unit, I advise emphasizing the interactive and visual components, as they significantly enhance student engagement. Additionally, ensure that students have ample opportunities to discuss and reflect on their learning, as these moments are crucial for deepening their understanding of the material. Finally, be prepared to offer extra support during the research phase to help students navigate and synthesize information effectively.
Background Information:
Bats are essential to the environment for several reasons:
- Pollination: Many bat species are pollinators, especially in tropical and desert climates. They pollinate various plants, including fruits like bananas, mangoes, guavas, and agave plants.
- Seed Dispersal: Bats help with seed dispersal, which is crucial for the regeneration and spread of various plant species. This helps maintain healthy forest ecosystems and promotes biodiversity.
- Pest Control: Bats consume vast amounts of insects, including agricultural pests and mosquitoes. This natural pest control reduces the need for chemical pesticides, benefiting crops and human health.
- Nutrient Cycling: Bat guano (feces) is a rich source of nutrients that enriches soil, promoting plant growth and aiding in ecosystem nutrient cycling.
- Indicator Species: Bats are sensitive to environmental changes and can serve as indicators of ecosystem health. A decline in bat populations often signals broader ecological issues.
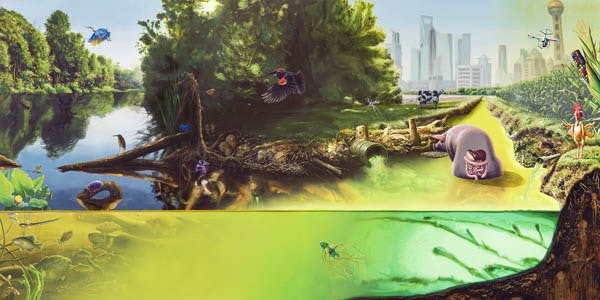
Biodiversity: The Impact of Population Density and Temperature Change on Bird Populations
Topic Keyword(s):
Ecosystems
Human Activity & Impacts
Weather & Climate
Guiding Question(s): What effects do temperature increase and human population density have on bird populations?
Learning Objectives:
- Students will identify areas with more or less threatened bird species, human population density and temperature change.
- Students will identify and compare areas that overlap the increased numbers of threatened birds with higher human population density and/or with greater temperature increase.
- Students will explain possible reasons for threats on bird populations due to high population density and temperature increase.
Standards Alignment:
Performance Expectations:
- MS-LS2-1: Analyze and interpret data to provide evidence for the effects of resource availability on organisms and populations of organisms in an ecosystem.
- MS-LS2-2: Construct an explanation that predicts patterns of interactions among organisms across multiple ecosystems.
- MS-ESS3-4: Construct an argument supported by evidence for how increases in human population and per-capita consumption of natural resources impact Earth's systems.
Link to Full Unit: Biodiversity: The Impact of Population Density and Temperature Change on Bird Populations
Estimated Length: 5-6 hours
Materials & Assets:
Featured Artwork:
Watershed, Alexis Rockman (2015). Collection Jonathan O'Hara © 2015 Alexis Rockman
Featured Data:
Threatened Birds
Population Density
Surface Temperature Anomaly
Survey Questions: Fenceposts Survey
Other Materials: Background Info on how Increased temperature and Cities impact birds:
Observation & Discussion Slide Deck: Powerpoint, pdf
Observation & Discussion with Data Tool
Fencepost Activity Handout
Student-Made Surveys Activity
How Does Climate Change Impact Birds? (reading & ?s)
In What Ways do Cities Affect Birds? (slides)
The Effects of Temperature and Cities on Birds (Students interpret temperature & population density maps and apply understanding of abiotic factor effects on bird populations.)
Assessment: Data Map Write-up
Advice for Educators: The unit allows for the teacher to tailor interesting images that support the unit objectives and to facilitate meaningful interactions between students and with the images. Students found the student product (the Redesigned Datamap) to be enjoyable and out of the ordinary, feeling more like an art project than a science assignment. At the same time, students readily discussed what they saw on their maps with their peers, engaging in productive and developmentally appropriate explanation and argument. Some students needed support adding the correct designs to their maps, especially if a small area showed a range of data that wasn’t necessarily shown in a clear or patterned manner on the original map. Students also had difficulty combining three tracing paper maps and being able to see the comparison of data from all three maps together. Students had further difficulty, possibly due to the previous factor, making observations and making meaning of the comparison of data shown on the three maps for a given location on the map. If I were to teach this unit again I would limit the geographical scope of the overall map, choosing to show one city or country instead of the entire world. Teachers should thoroughly review datamap originals and consider technical language used, incorporating as background content into the unit. Additionally, teachers should plan for how students will use the finished student products in their curriculum, and consider how the combination of the three redesigned maps may be a jumping off point for further exploration of a topic or phenomenon in their curriculum.
Background Information:
Plate Tectonics: Plate Boundaries, Earthquakes, and Volcanoes
Topic Keyword(s):
Earth & the Solar System
Guiding Question(s):
- How are the locations of plate boundaries, earthquakes, and volcanoes explained by the motion of Earth’s tectonic plates?
- Are the locations of earthquakes random or is there a pattern to their locations?
- Are the locations of volcanoes random or is there a pattern to their locations?
Placement in Curriculum:
This was an excellent activity to start a plate tectonics unit, even before discussing any content-specific topics involving earthquakes, volcanoes, or plate tectonics.
Learning Objectives: Earthquake and volcano locations are explained by the theory of plate tectonics, the idea that Earth’s crust is divided into a series of plates that are in slow, constant motion due to convectional forces within and below the mantle.
Standards Alignment:
Performance Expectations:
- MS-ESS3-2. Analyze and interpret data on natural hazards to forecast future catastrophic events and inform the development of technologies to mitigate their effects.
Science & Engineering Practices:
- Analyzing and Interpreting Data: Analyze and interpret data to determine similarities and differences in findings.
Disciplinary Core Ideas:
- ESS3.B: Natural Hazards: Mapping the history of natural hazards in a region, combined with an understanding of related geologic forces can help forecast the locations and likelihoods of future events.
Crosscutting Concepts:
- Patterns: Graphs, charts, and images can be used to identify patterns in data.
Link to Full Unit: Plate Tectonics: Plate Boundaries, Earthquakes, and Volcanoes
Estimated Length: 4 hours
Materials & Assets:
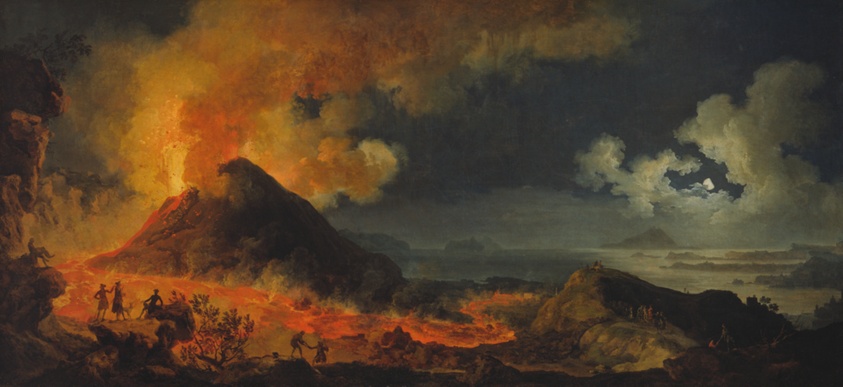
Featured Artwork: Pierre-Jacques Volaire, French, 1729–c. 1790-1800. The Eruption of Vesuvius
Featured Data:
Volcano Locations
Earthquakes 2001-2015 (Animation)
Population Density
Earthquakes 2005-2015
Plate Boundaries
Survey Questions: Fenceposts Questions
Other Materials:
Observation & Discussion Slide Deck: Powerpoint, pdf
Assessment (Optional): Assessment during this unit was participation based, where students received full credit for completing all activities. Following the BIO unit, students engaged in traditional learning activities and completed formative and summative electronic Canvas assessments.
Advice for Educators: Students were creative with the chosen artwork and generated stories involving the human figures. When overlaying the data sketches maps, most students had an “aha” moment of noticing that earthquakes, volcanoes, and plate boundaries almost all line up perfectly. However, students needed more time for data sketches that I anticipated. Seeing that students were all engaged in the activity made this extension a worthwhile use of extra time.