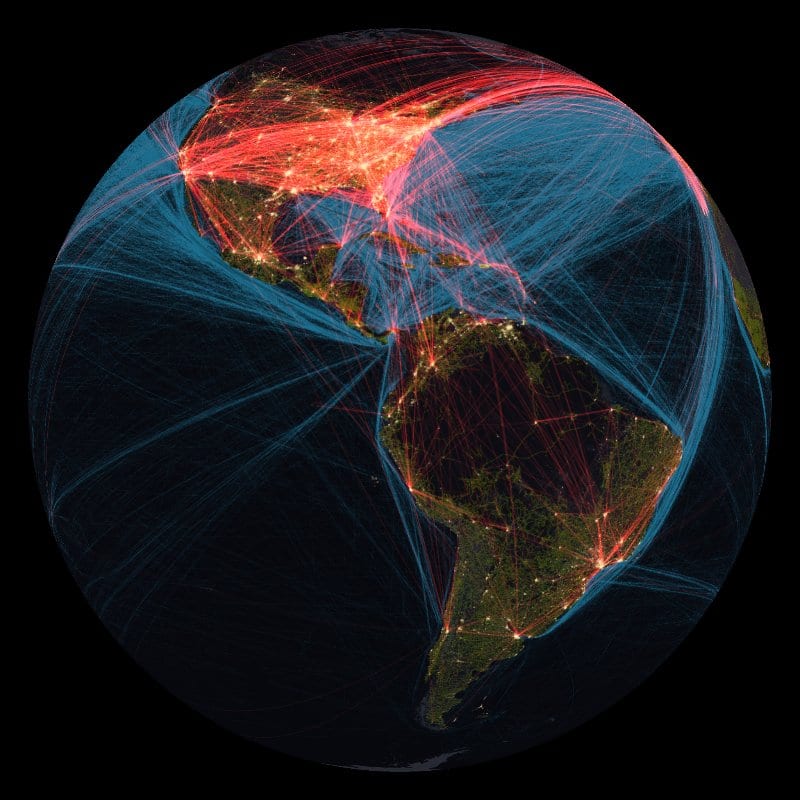
It isn’t all weather and earth science on the Sphere, we also have human related datasets. In this Human Transportation dataset, global transportation on land, in air, and by sea shows our human footprint and all the energy we use to support our interconnectedness. Red lines represent 87,000 daily flights, blue lines represent the paths of 3500 commercial vessels over the course of a year, and green lines represent roads used by over 1 billion motor vehicles. These lines are overlain on a map of nighttime lights visible from space, indicating areas where people live, work, and consume energy.