Teacher’s Toolbox


Overview
The Building Insights through Observation (BIO) framework combines arts-based instructional approaches with science content and data to build observation and critical thinking skills in middle school students. By slowing down, considering design tools and techniques, and discussing ideas and interpretations, BIO supports student-driven sensemaking of data and Earth science content.
Since the project began in July 2021, the project team has engaged in a research process to iteratively develop, test, and refine a cross-disciplinary instructional framework and professional development model with 10 middle school science teachers, using their classrooms to examine how these practices support students’ data literacy and reasoning skills. We invite you to explore the model and consider using it in your classroom. The model’s adaptability supports differentiation for various learner needs and you will find tools, examples, and lessons in this toolbox.
Theory and Approaches
This toolbox offers resources used to build skills, knowledge, and mindsets needed to integrate arts-based pedagogies into science teaching with high quality, scientific data visualizations. Grounded in constructivist learning theory, our approach weaves together evidence-based frameworks from a variety of disciplines to achieve this goal.
The BIO approach is a new angle on teaching data literacy to middle school students. A lot of existing data literacy instruction assumes that students need to learn the mechanics of manipulating and depicting raw data if they are going to understand what those data visualizations are showing.
But that’s not how the majority of data are encountered.
The average consumer encounters data that have already been wrangled and visualized in some form – whether by scientists, journalists, or standardized test designers. That means students need to develop the skills to approach any data visualization that crosses their path:
- To observe its details
- To notice its visual patterns
- To interpret multiple meanings
- To apply science concepts to their interpretations
- To question and critique the data (and biases) that underly the visual
How is BIO a different approach to data literacy?
Looking at this need for stronger data consumers, we realized core skills are not about science concepts and mathematics – they are forms of visual literacy.
As it turns out, the field of visual art education has been working on this problem for years. Art educators have a toolbox of facilitation practices and techniques to help learners observe, interpret, and critique visual information.
We wondered: What if we used those practices and replaced works of art with data visualizations?
The Intersection of Visual, Design, & Content Literacy
We propose this approach to data literacy as being an intersection of a Venn diagram of skills. The BIO approach activates each of these skill sets and intertwines them so that they can be used together to be a critical consumer of visualized data about scientific topics:
- Visual Thinking: skills of critically looking and interpreting visual representations of information
- Design Thinking: skills of critically constructing visual representations to convey meaning
- Content Understanding: knowledge about concepts or content that may be applied to visual information
Geospatial Data Visualizations: A Starting Point
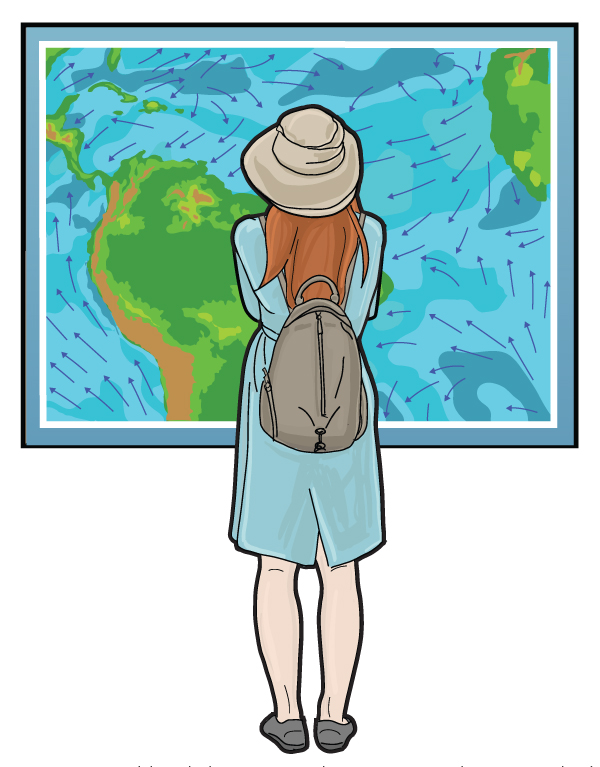
For the first phase of this work, we have focused on geospatial (map-based) data visualizations – drawing on a massive, rich library of resources from NOAA and other public entities.
Map-based data can be a fruitful starting point for engaging students in data literacy. The familiar elements of the underlying map offer a visual anchor that is a broadly accessible starting point.
But the truth is, these maps use complex symbolic systems to represent complex phenomena. The graphics offer endless possibilities of details, patterns, anomalies, and interpretations that could be drawn. No map-based data visualization tells just one story. The BIO approach helps students discover those stories themselves as they begin to understand the language of data.